
Financial Information | Ajanta Pharma Investors


Overview
- Home - Investors
- Financials
- Overview
Note:
- Adjusted EBITDA excludes mark-to-market (MTM) foreign-exchange loss
- RoNW calculated as Net profit/Average net worth
- RoCE calculated as EBIT/(Net worth + Lease liability + Deferred tax liability)
- Bonus issue in April 2022 adjusted in all years for calculation of EPS & Book Value
- EBITDA = earnings before interest, tax, depreciation and amortisation
i
Ajanta Pharma Financial Highlights, FY22 to FY26
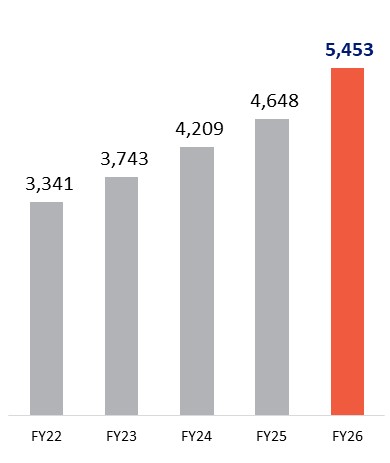
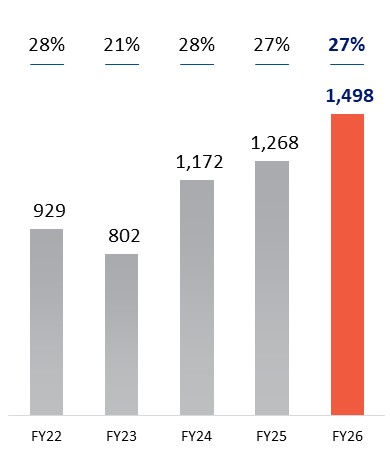
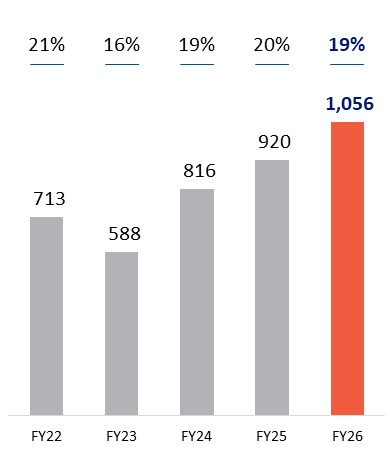
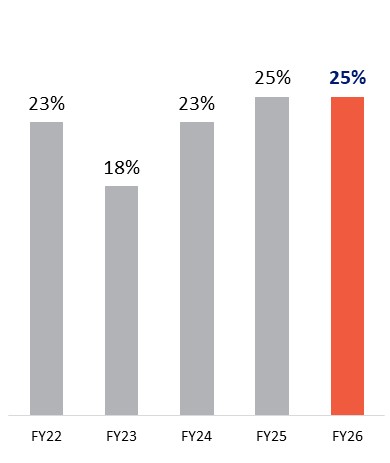
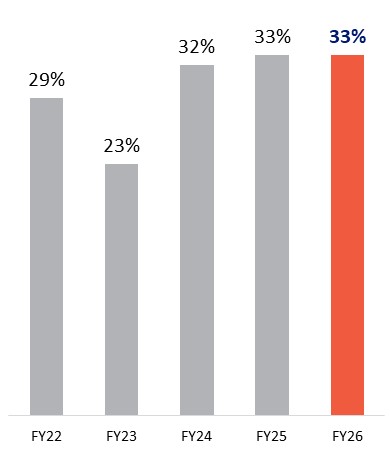
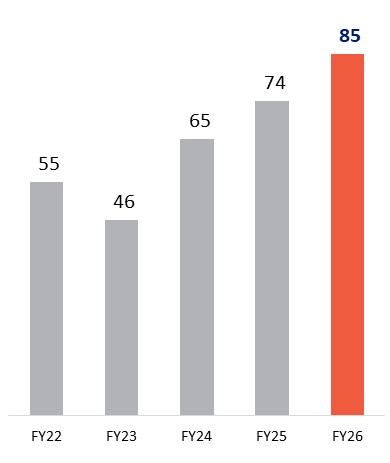
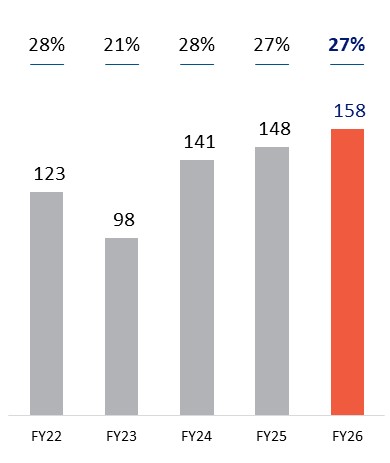
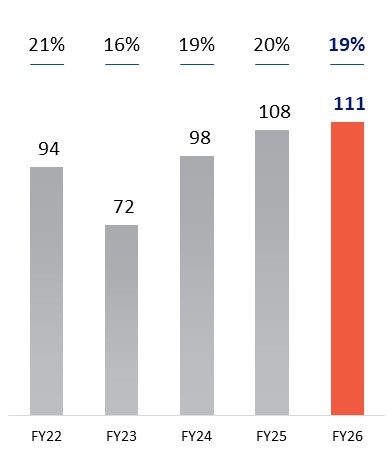
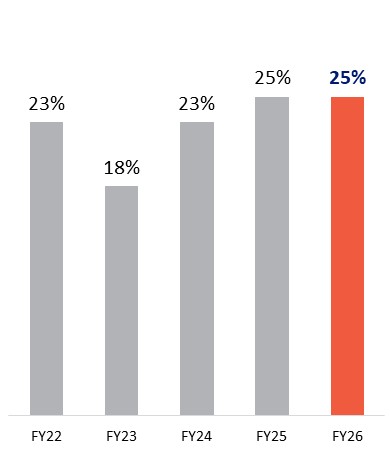
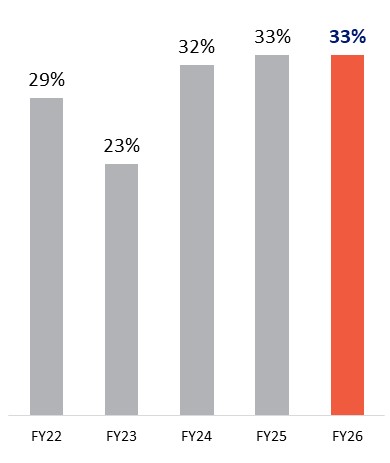
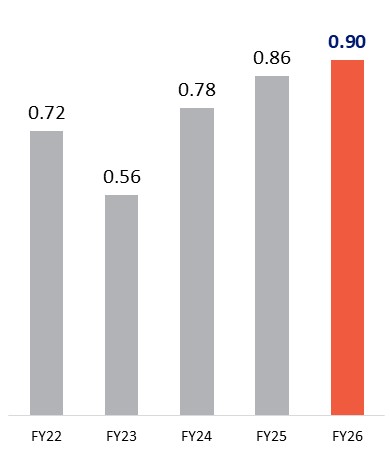
Revenue from operations grew from ₹3,341 crore in FY22 to ₹5,453 crore in FY26, a compound annual growth rate of about 13%. In FY26, Adjusted EBITDA was ₹1,498 crore (27% margin) and net profit was ₹1,056 crore (19% margin), with a return on net worth of 25%, return on capital employed of 33% and earnings per share of ₹85.
| Sr No | Metric | FY22 | FY23 | FY24 | FY25 | FY26 |
|---|---|---|---|---|---|---|
| 1 | Revenue from Operations (₹ crore) | ₹3,341 | ₹3,743 | ₹4,209 | ₹4,648 | ₹5,453 |
| 2 | Adjusted EBITDA (₹ crore)1 | ₹929 | ₹802 | ₹1,172 | ₹1,268 | ₹1,498 |
| 3 | Adjusted EBITDA Margin (%) | 28% | 21% | 28% | 27% | 27% |
| 4 | Net Profit (₹ crore) | ₹713 | ₹588 | ₹816 | ₹920 | ₹1,056 |
| 5 | Net Profit Margin (%) | 21% | 16% | 19% | 20% | 19% |
| 6 | Return on Net Worth, RoNW (%)2 | 23% | 18% | 23% | 25% | 25% |
| 7 | Return on Capital Employed, RoCE (%)3 | 29% | 23% | 32% | 33% | 33% |
| 8 | Earnings Per Share, EPS (₹)4 | ₹55 | ₹46 | ₹65 | ₹74 | ₹85 |
| Sr No | Metric | FY22 | FY23 | FY24 | FY25 | FY26 |
|---|---|---|---|---|---|---|
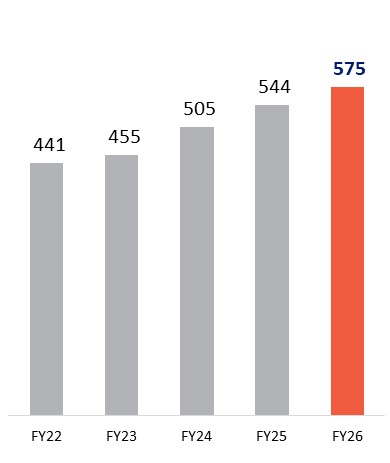
| 1 | Revenue from Operations ($ million) | $441 | $455 | $505 | $544 | $575 |
| 2 | Adjusted EBITDA ($ million)1 | $123 | $98 | $141 | $148 | $158 |
| 3 | Adjusted EBITDA Margin (%) | 28% | 21% | 28% | 27% | 27% |
| 4 | Net Profit ($ million) | $94 | $72 | $98 | $108 | $111 |
| 5 | Net Profit Margin (%) | 21% | 16% | 19% | 20% | 19% |
| 6 | Return on Net Worth, RoNW (%)2 | 23% | 18% | 23% | 25% | 25% |
| 7 | Return on Capital Employed, RoCE (%)3 | 29% | 23% | 32% | 33% | 33% |
| 8 | Earnings Per Share, EPS ($)4 | $0.72 | $0.56 | $0.78 | $0.86 | $0.90 |
Notes: FY = financial year ending 31 March. Figures are consolidated. 1 Adjusted EBITDA excludes mark-to-market (MTM) foreign-exchange loss; EBITDA = earnings before interest, tax, depreciation and amortisation. 2 RoNW = net profit / average net worth. 3 RoCE = EBIT / (net worth + lease liability + deferred tax liability). 4 EPS adjusted in all years for the bonus issue of April 2022.